
 A Brief History Of Candlestick Charts
 A Brief History Of Candlestick Charts
As early as the 1600’s in Japan, candlestick charts were developed for predicting rice prices. Interestingly enough, rice futures was one of the world’s first commodity futures markets.
This explains why many of the candlestick formation terminology are based on Japanese words. For example, have you heard of the Harami Pattern? The book “Japanese Candlestick Charting: A Contemporary Guide to the Ancient Techniques of the Far East” by Steve Nison explains that “Harami” is an old Japanese word that means pregnant.
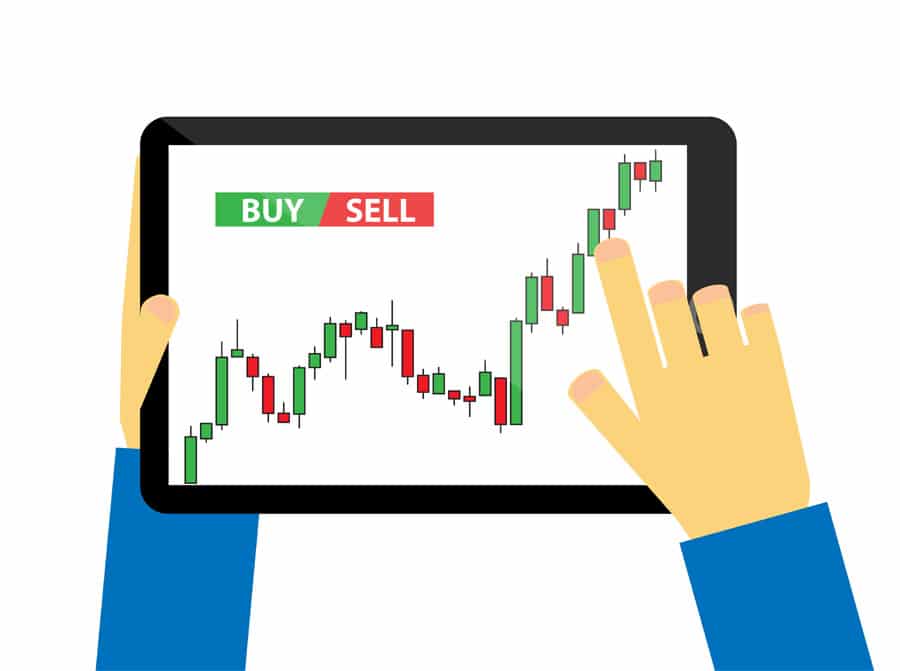
Of course, while the Japanese pioneered the use of candlestick charts and many of the terminology is still used today, modern candlestick charts based on technical analysis has been enhanced and improved. This technique is commonly used in all financial markets, but it is especially helpful in Forex.
Candlestick Charts – Key Features
Candlesticks charts look similar to bar charts. Each candlestick is composed of a currency pair’s open, high, low and close prices. The candlestick consists of a rectangular section; the body, and two thin lines above and below this section; the wicks.
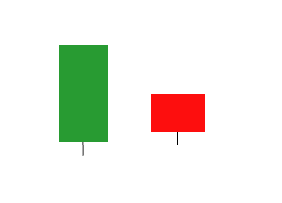
The color depiction of the candlestick makes it simple for traders to understand market activity. In most charts, the body is green or blue if the price closed higher and red if the price closed lower.
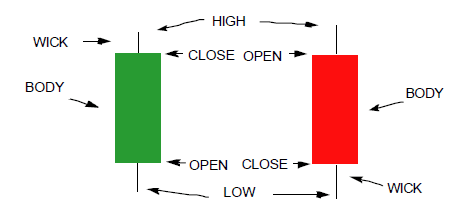
The body of the candlestick represents the difference between the open and the close. The wicks show the high and low price of the respective time period of the candlestick.
How Can Candlesticks Be Used For Trading?
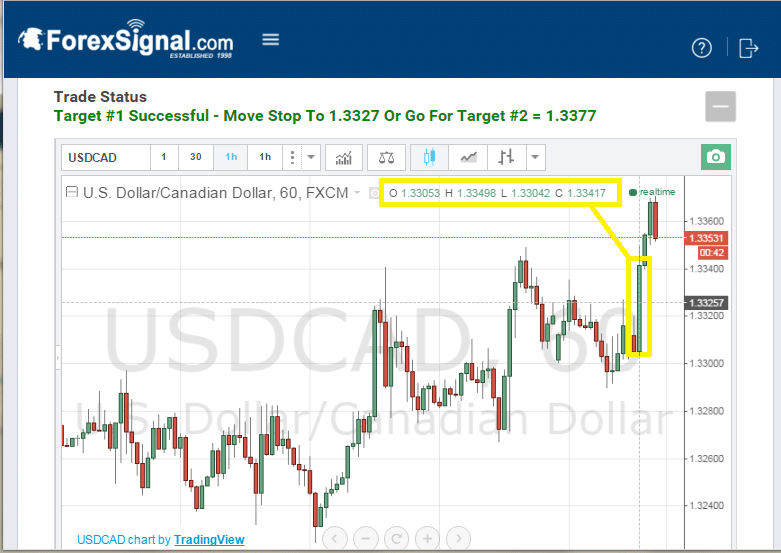
Candlestick formations can be used to predict price reversals in price or to confirm a trend continuation. Future blog posts will provide insight into specific candlestick formations that can be used for Forex trading. The ForexSignal.com Trading Team is skilled and experienced at reading candlestick formations. If you would like to learn more about candlesticks and other technical analysis with one-on-one Forex mentoring, contact us today and we will be happy to provide more information.


Leave a Reply
You must be logged in to post a comment.