
 Support and Resistance – Explained
 Support and Resistance – Explained
Support and Resistance are two of the most basic and important terms when it comes to understanding fundamentals of Foreign exchange trading. Understanding both these terms is not a rocket science and the underlying concepts can be easily understood by spending some time in learning and finding these levels on charts. Most people still ignore the importance of these fundamental concepts and therefore often fail in their endeavor of becoming a successful trader. This article has been dedicated to explaining both these terms in an adequate manner because of the core importance they have in the overall understanding of trading.
Support:
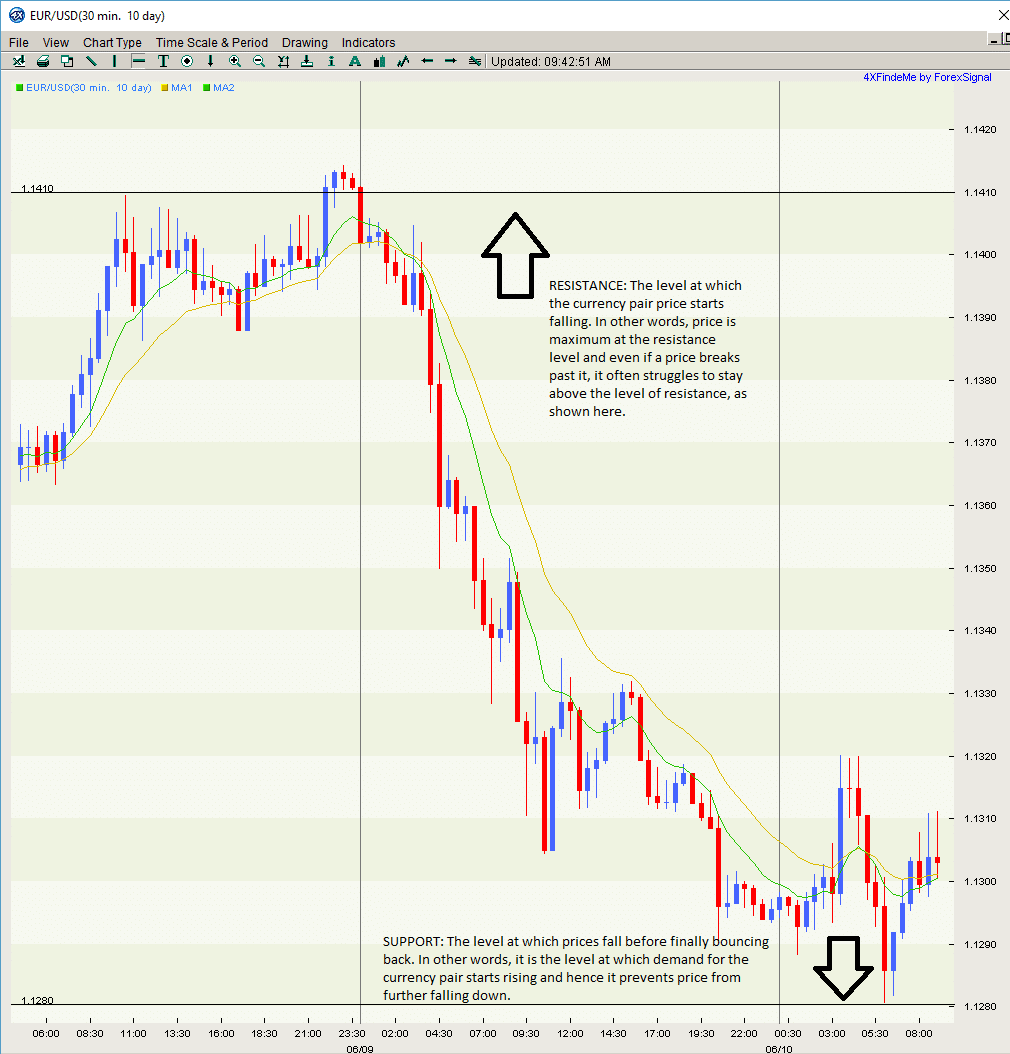
Support is the minimum level at which prices fall before finally bouncing back. In other words, it is the level at which demand for the currency pair starts rising and hence it prevents price from further falling down. Buyers start looking to buy at or near this level as the prices are not expected to go further below.
Resistance:
On the other hand, resistance is the opposite of support and it is the level at which the currency pair price starts falling. In other words, price is maximum at the resistance level. Moreover, it is an attractive price for sellers to sell as the price is expected to decline in the future.
Before we move any further, it is important to understand that there is no single best way to predict or depict these levels and different methods are in practice for identification and representation of both these support and resistance level. However, one of the common and frequently used methods is to show horizontal price value as resistance or support. Once you understand the basic concepts and have enough practice, the levels can be identified by simply looking at a chart.
Why does it happen?
The concept of support and resistance levels can also be explained with respect to market or crowd psychology. There is no universal way to predict both these levels and the predictions are often based upon the general trends and psychology of the investors. It is usually estimated that both buyers and sellers would be interested in buying and selling respectively up to a certain limit.
Role reversal:
There is no guarantee that predicted support and resistance levels would always hold true. If a price breaks through an established support or resistance level, this is called a breakout. As a result, often the role of any broken resistance or support level is reversed in this situation. For example, suppose that the support level has been broken and the price fell below this level. The earlier support level will now become the new resistance level. The opposite is also true in the case of a resistance level. If the price of a currency pair breaks above the resistance level, the resistance level now becomes the new support level.
Horizontal Line:
In order to take maximum advantage, it is recommended to draw horizontal lines on charts in order to improve the visibility of the important areas. It is also important to understand that horizontal levels should be considered as a zone rather than merely a single point.
The chart can be drawn for different time periods, depending upon one’s preference. The basic period is considered to be daily where a single candlestick would represent a single day. However, depending on a trader’s preference and individual circumstances, charts can also be drawn on 30 minutes, hourly or weekly basis. These horizontal levels can be found on each time frame.


Leave a Reply
You must be logged in to post a comment.