
 The Moving Average is one of the most popular indicators in technical analysis as it helps eliminate minor fluctuations and gives traders a clear, smooth depiction of price over a standard period of time and are used to help identify the overall trend.
Although Moving Averages are often the first indicator that new traders are taught, they are also utilized by fund managers & investment banks in their analysis to see if a market is nearing support or resistance, or potentially reversing after a significant trending period. This indicator is so commonly used that it is important for any and all currency traders to watch and understand.
What is a Moving Average?
MA’s take a fixed set of data and give you an average price. If the average is moving higher, the price is in an uptrend on at least one or possibly multiple time-frames. Moving averages alone are less accurate. However, when it is combined with other indicators, it is a useful for pinpointing important trading levels.
Moving Average – Why so Popular?
Moving averages are simple to understand and can be helpful in recognizing trending, ranging, or corrective trading environments. Often traders use two moving average lines together to help confirm or identify a trend.
How To Use Two Moving Averages As A Trend Trigger
When using two Moving Averages to identify or confirm a trend, one of the moving averages is called a faster moving average and the other is the slower moving average.
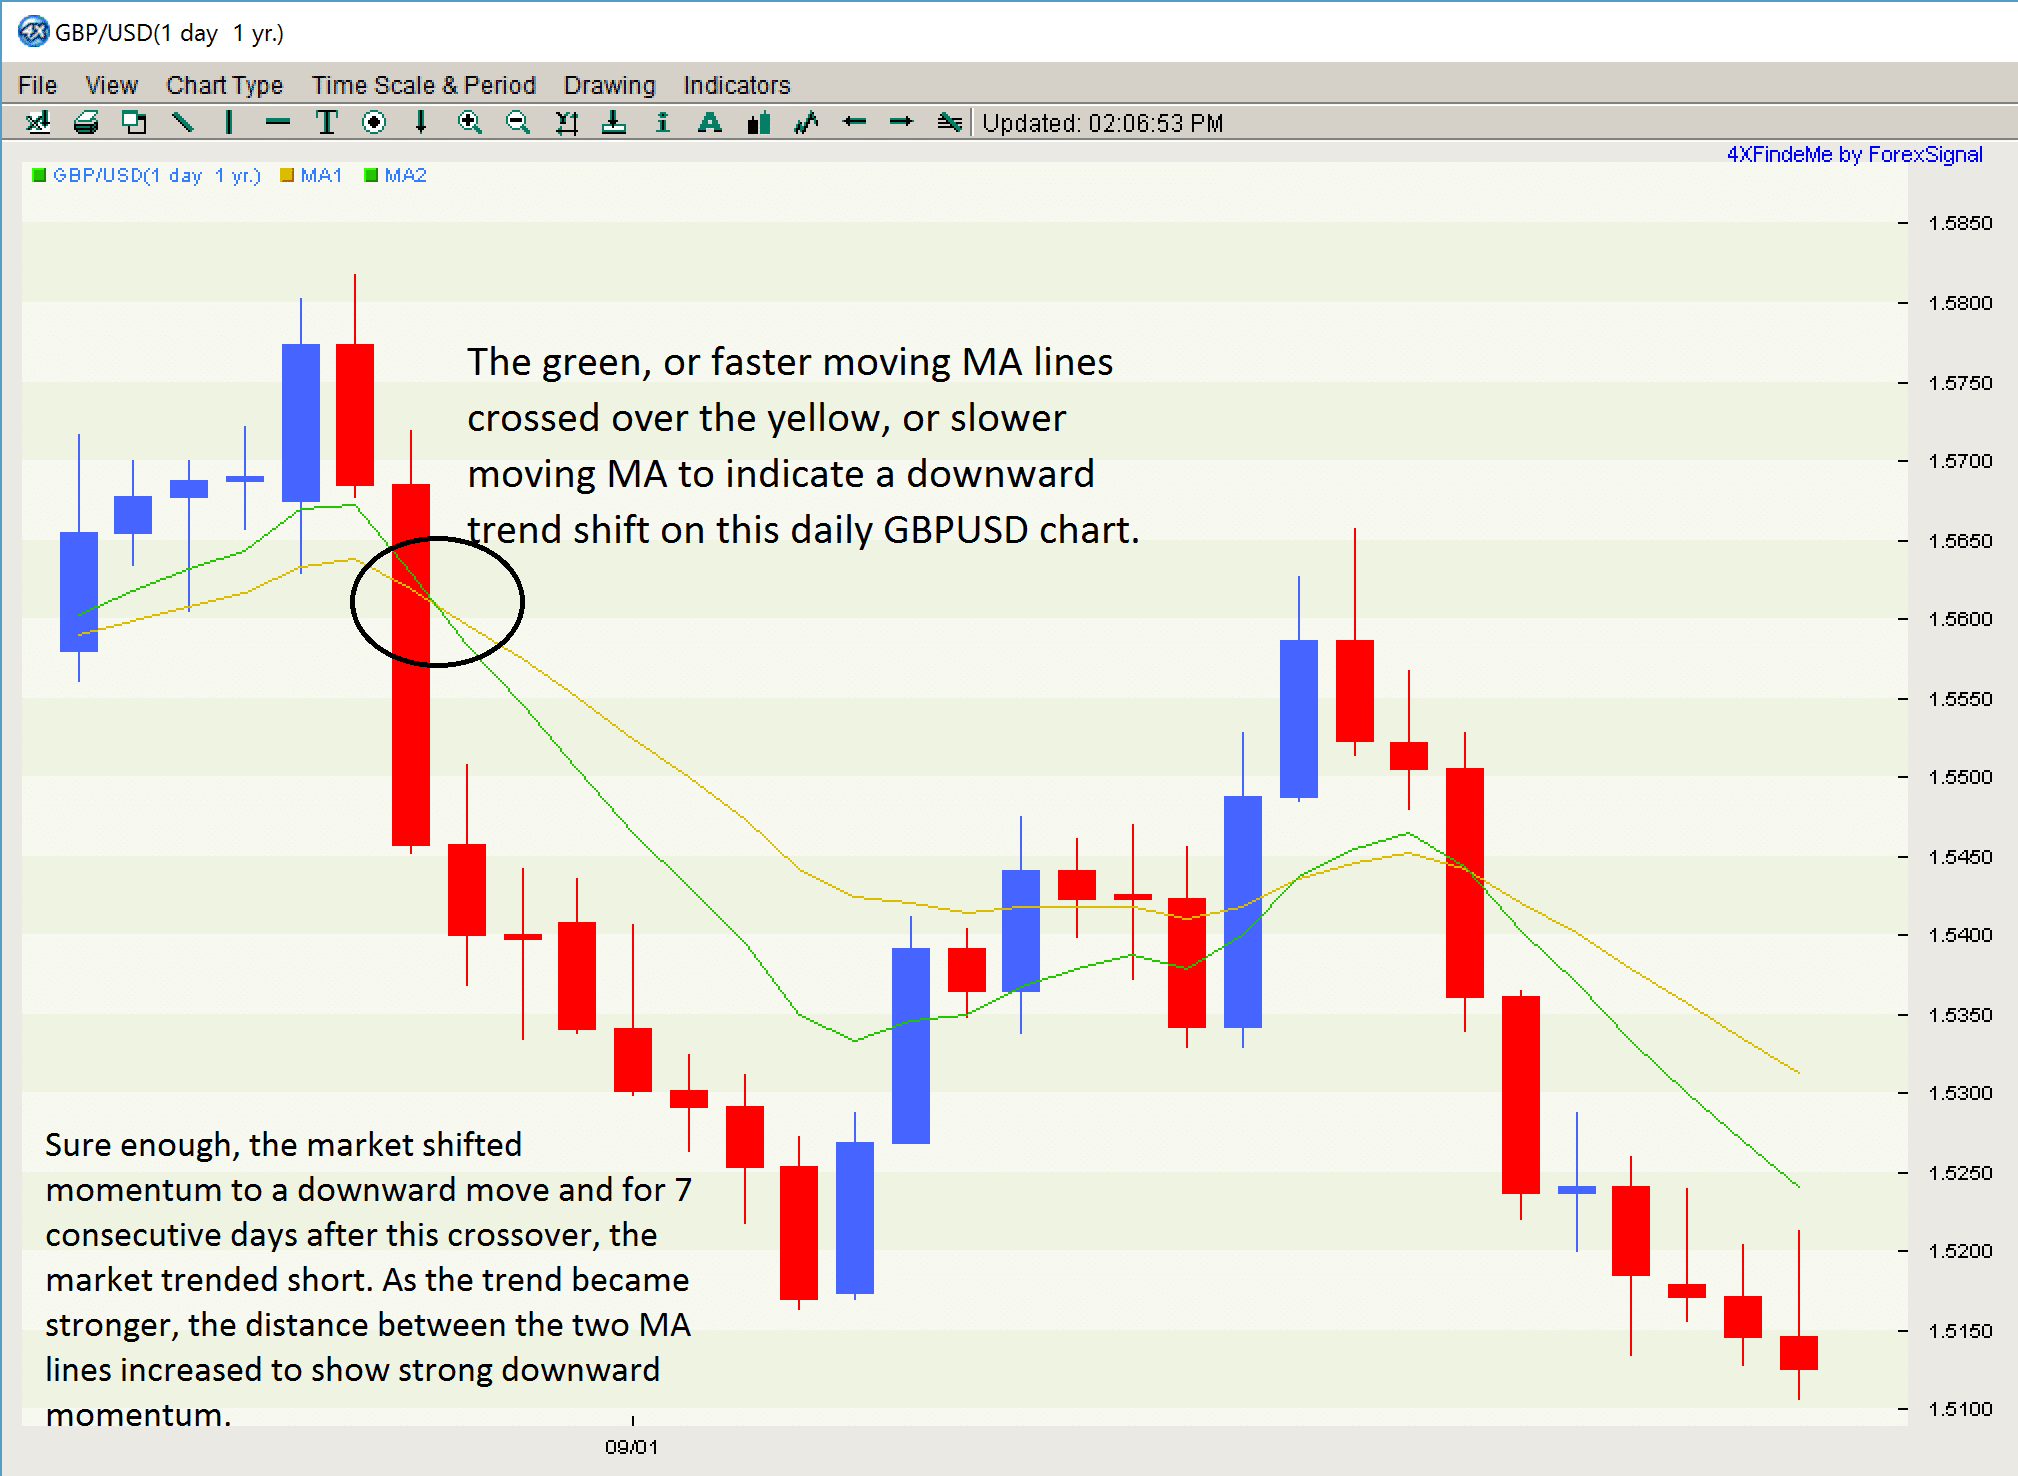
In the chart below, the faster moving, or higher number average, is green and the slower moving, or lower number average, is yellow.
When the faster moving average crosses above or below the slower moving average, this indicates either buying or selling momentum, respectively.
In the example chart below, the green, or faster moving MA lines crossed over the yellow, or slower moving MA to indicate a downward trend shift on this daily GBPUSD chart. Sure enough, the market shifted momentum to a downward move and for 7 consecutive days after this crossover, the market trended short. As the trend became stronger, the distance between the two MA lines increased to show strong downward momentum.
The 100 & 200 Moving Averages are the most widely used but any number can be selected.
It is often best to choose and stick with just a few specific moving averages. Don’t waste time trying to find the “perfect moving average” but instead be consistent in whichever MAs you choose to use. If you can get comfortable with a specific set of moving averages, you can objectively analyze the overall trend and trade the Forex market week in and week out.


Leave a Reply
You must be logged in to post a comment.